
As I’ve recently started working on data driven projects, I’ve been constantly advised by my senior data science coleagues that is very important to understand the data science lifecycle and different approaches around it, and adapt the one that works best for me. In this journey, I’ve found really useful resources that I summarise in this article. First, I present what a data science lifecycle looks like and then an approach of work that can be intergrated within the that lifecycle.
The Data Science lifecycle
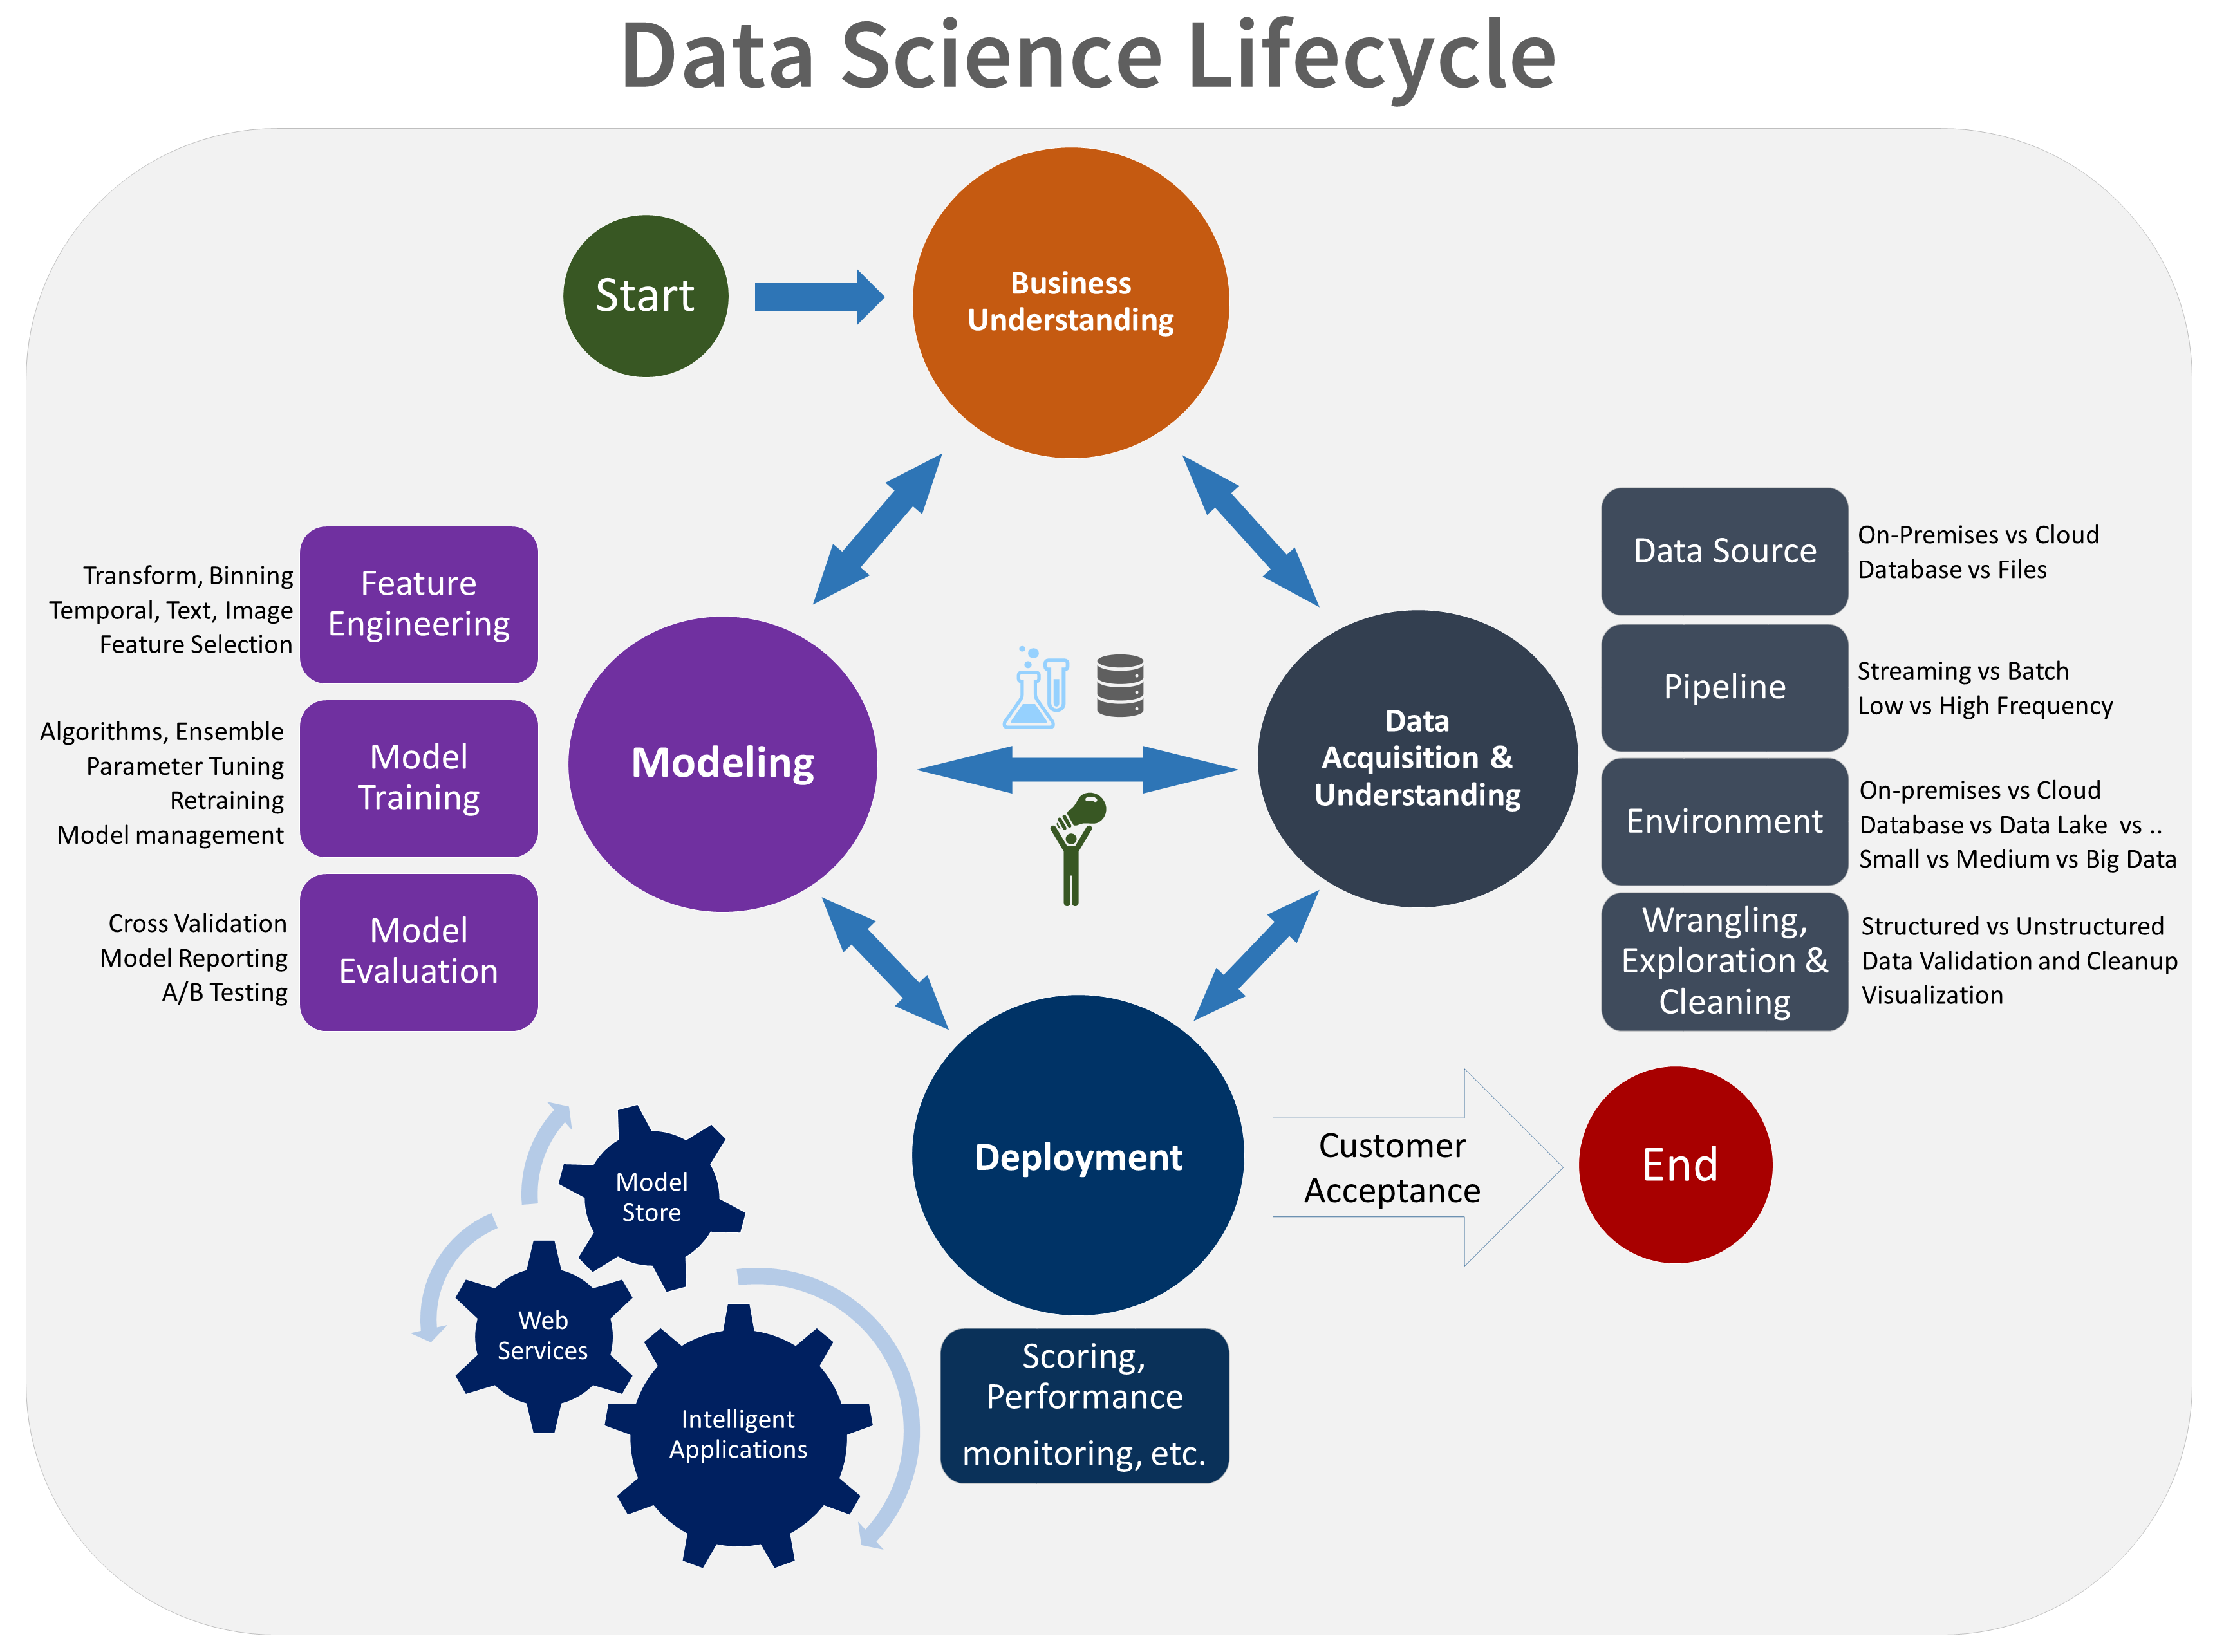
The lifecycle outlines the major stages that projects typically execute, often iteratively:
- Business Problem Understanding
- Data Aquisition and Understanding
- Predictive Modeling and Evaluation
- Deployment
Here is a visual representation of the Team Data Science Process lifecycle.
Steps of the DS Lifecycle
Bussiness Problem Understanding
At this first stage we specify the key variables (as objectives) that are to serve as the model targets and whose related metrics are used determine the success of the project. We also need to identify the relevant data sources that the business has access to or needs to obtain.
Define objectives
-
Identify the key business variables that the analysis needs to predict. We refer to these variables as the model targets. Two examples of such targets are sales forecasts or the probability of an order being fraudulent.
-
Define the project goals by asking and refining “sharp” questions that are relevant, specific, and unambiguous. Data science is a process that uses names and numbers to answer such questions. You typically use data science or machine learning to answer five types of questions:
- How much or how many? (regression)
- Which category? (classification)
- Which group? (clustering)
- Is this weird? (anomaly detection)
- Which option should be taken? (recommendation)
-
Define the project team by specifying the roles and responsibilities of its members. Develop a high-level milestone plan that you iterate on as you discover more information.
-
Define the success metrics. For example, you might want to achieve a customer churn prediction.
Data Aquisition and Understanding
Data Mining
Data mining is the process of gathering data from different sources. Some people tend to group data retrieval and cleaning together, but each of these processes are different. Some of the questions worth considering are — what data do I need for my project? Where does it live? How can I obtain it? What is the most efficient way to store and access all of it?
If the data lives in databases, you can query the relevant data using SQL queries, or manipulate it using a data frame tool like Python Pandas. If the data doesn’t exist in a dataset, you’ll need to scrape it. Beautiful Soup is a popular library used to scrape web pages for data. Google Analytics can be useful when working on an app, allowing you to define custom events within the app which can help you understand how your users behave and collect the corresponding data.
Data Cleansing
This process can often take 50 to 80 percent of the data scientist’s time as there are so many possible scenarios that could necessitate cleaning. This is just a subset of examples where you can see inconsistencies, and it’s important to catch and fix them in this stage.
One of the steps that are often forgotten in this stage, causing a lot of problems later on, is the presence of missing data. Missing data can throw a lot of errors in the Machine learning model creation and training. One option is to either ignore the instances which have any missing values. Depending on your dataset, this could be unrealistic if you have a lot of missing data. Another common approach is to use something called average imputation, which replaces missing values with the average of all the other instances. This is not always recommended because it can reduce the variability of your data, but in some cases it makes sense.
Data Exploration and Understanding
This is where you understand the patterns and bias in your data.
Things to try:
- Pulling up and analyzing a random subset of the data using Pandas
- Plotting a histogram or distribution curve to see the general trend
- Even creating an interactive visualization that lets you dive down into each data point and explore the story behind the outliers
- Plot features as a heatmap
Feature Engineering
In machine learning, a feature is a measurable property or attribute of a phenomenon being observed. Feature engineering is the process of using domain knowledge to transform your raw data into informative features that represent the business problem you are trying to solve. This stage will directly influence the accuracy of the predictive model you construct in the next stage. Coming up with features is difficult, time-consuming and requires expert knowledge.
We typically perform two types of tasks in feature engineering — feature selection and construction.
Feature selection: It is the process of cutting down the features that add more noise than information. This is done to avoid the curse of dimensionality, which refers to the increased complexity that arises from high-dimensional spaces (i.e. way too many features).
We can generally use:
- Filter methods (apply statistical measure to assign scoring to each feature)
- Wrapper methods (frame the selection of features as a search problem and use a heuristic to perform the search)
- Embedded methods (use machine learning to figure out which features contribute best to the accuracy).
Feature construction: It involves creating new features from the ones that you already have (and possibly ditching the old ones). An example of when you might want to do this is when you have a continuous variable, but your domain knowledge informs you that you only really need an indicator variable based on a known threshold.
Modeling
Predictive Modeling
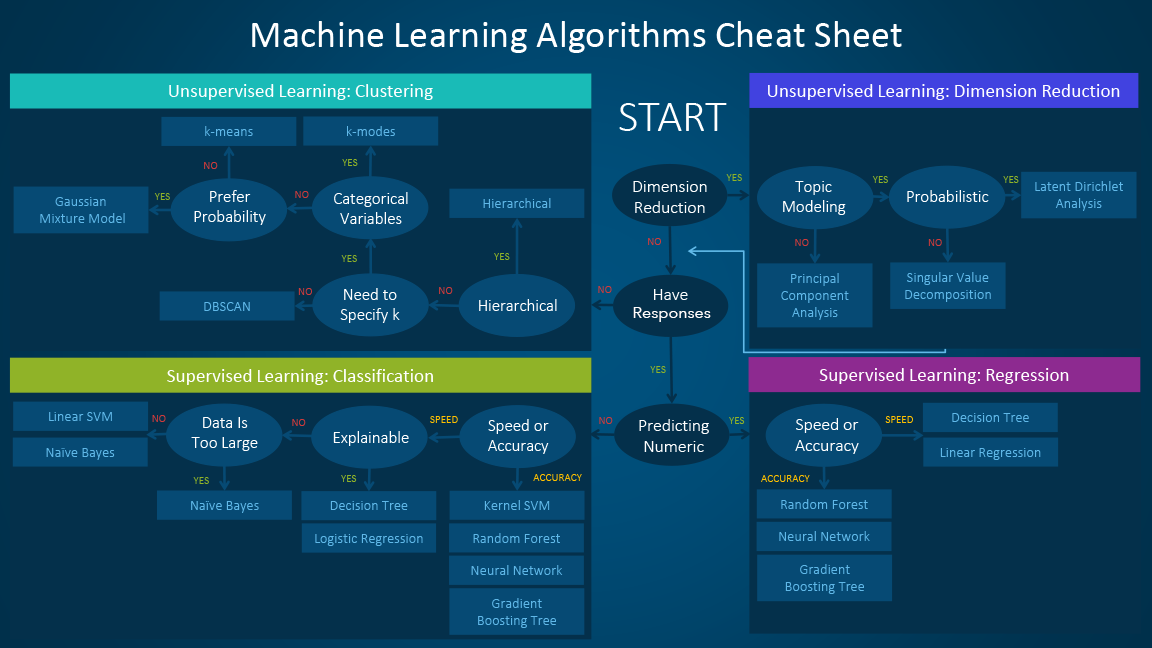
Based on the questions you asked in the business problem understanding stage, this is where you decide which model to pick for your problem. The model (or models, and you should always be testing several) that you end up training will be dependent on the size, type and quality of your data, how much time and computational resources you are willing to invest, and the type of output you intend to derive. Two cheatsheets that can help with the model selection are the following:

Validating the model
Potential validation methods:
Once the model is trained, it is critical to evaluate its success.
1. k-fold cross-validation
It’s a commonly method that measures the accuracy of a model. An alternative to splitting the dataset into a train/ and a test parts:
- Separates the dataset into k equally sized groups of instances
- Trains on all the groups except one
- Repeats the process with different groups left out
This allows the model to be trained on all the data instead of using a typical train-test split.
2. Percent Correct Classification
This is applied on classification models. Tests accuracy along with a confusion matrix which breaks down the errors into false positives and false negatives.
3. Regression Models Evaluations
Common metrics include the coefficient of determination (which gives information about the goodness of fit of a model), mean squared error (MSE), and average absolute error.
Data Visualization
Data viz combines the fields of communication, psychology, statistics, and art, with an ultimate goal of communicating the data in a simple yet effective and visually pleasing way. Some ideas to try are:
- Interactive Python notebook like Jupyter
- Plotly (both python & R): makes it really easy to drag-and-drop your data into visualization and manipulate it to get more complex visualizations
- Matplotlib: The most common python library for visualization based on which many other python libraries are build on. Derived from MatLab.
- Bokeh Python Library
- Seaborm Python Library
- BI Tools: Tools like Tableau, Bussimess Objects, PowerBI for high level visualizations
Evaluating the Solution
This is where you evaluate how the success of your model relates to your original business understanding. Does it tackle the problems identified? Does the analysis yield any tangible solutions? If you encountered any new insights during the first iteration of the lifecycle, you can now infuse that knowledge into the next iteration to generate even more powerful insights and unleash the power of data to derive phenomenal results for your business or project.
Deployment
The last step of the build phase is executing the build plan for the product. Most software engineers are probably familiar with the trials and tribulations of building a complicated piece of software, but they may not be familiar with. Statisticians, on the other hand, know what it’s like to have dirty data but may have little experience with building higher-quality software. Likewise, individuals in different roles relating to the project, each of whom might possess various experiences and training, will expect and prepare for different things.
After you have a set of models that perform well, you can operationalize them for other applications to consume. Depending on the business requirements, predictions are made either in real time or on a batch basis. To deploy models, you expose them with an open API interface. The interface enables the model to be easily consumed from various applications, such as:
- Online websites
- Spreadsheets
- Dashboards
- Line-of-business applications
- Back-end applications
Generally speaking, in a data science project involving statistics, expectations are based either on a notion of statistical significance or on some other concept of the practical usefulness or applicability of those results or both. Statistical significance and practical usefulness are often closely related and are certainly not mutually exclusive.
CI/CD
Find more information on that here.
Continues integration is more of a continuous process rathen than a single step on its own.
Why don’t we use continuous integration already in ML? Some reasons are cultural, like a low crossover between data science and software engineering communities. Others are technical- for example, to understand your model’s performance, you need to look at metrics like accuracy, specificity, and sensitivity. You might be assisted by data visualizations, like a confusion matrix or loss plot. So pass/fail tests won’t cut it for feedback. Understanding if a model is improved requires some domain knowledge about the problem at hand, so test results need to be reported in an efficient and human-interpretable way
Ways of work
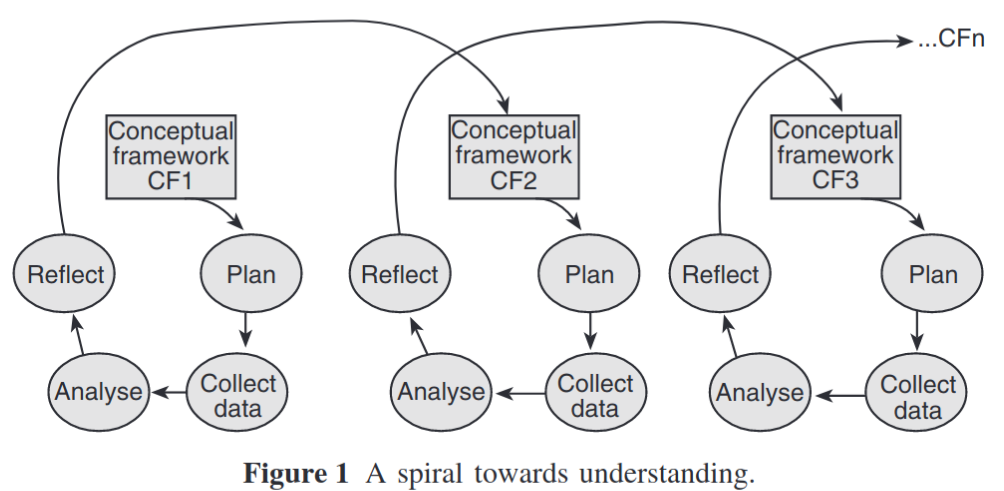
The approach that is presented here is the Structured-case: a methodological framework for buildingtheory in information systems research. The structured-case research cycle is conceptual-ised in four stages, which have been adapted from prac-tice-based models of organizational research. While the four stages are described below as inclusive and separate, in practice they are fluid and ill-defined, allowing much iteration between adjacent stages. Consequently, movement through thecycle does not follow any set, sequential pattern.
- Plan: Investigation of the research themes is planned. The research paradigm and the concepts and relation-ships in the conceptual framework are used to select are search design.
- Collect data: Data are collected and recorded, guidedinitially by the plan outlined in the previous stage. It should be noted that, although collecting and analysing the data are modelled as separate stages, in practice they may be closely interrelated.
- Analyse: Qualitative research typically involves vast amounts of raw data; analysis is the process of organising and reducing this data so that the researcher can bring meaning to it. Coding is one of the most common approaches to qualitative data analysis. Analysis is not a one-off activity but rather an ongo-ing, iterative task that may involve reading and rereadingtranscripts many times in order to gain deep understand-ing of the data and the underlying themes and patterns contained in it.
- Reflect:
- Reviewing the research process, such as methods to collect and analyse data
- Evaluating the outcomes of analysis
- Reviewing the structures of structured-case
- Looking beyond the data to build theory
- Changing the conceptual framework to incorporatethe knowledge accumulated and theory built
sources:
- Team Data Science Process Documentation (TDSP) by Microsoft Azure’s blog
- Data Science Life Cycle 101 for Dummies like Me by Sangeet Moy Das
- Structured-Case: A Methodological Framework for Building Theory in Information Systems Research by Paul Anthony Swatman
- What data scientists need to know about DevOps